How We Improved Lighthouse Performance from 30 to 95 with Modern Cloud Infrastructure
Discover how we optimized the Asynx Devs website to boost Lighthouse performance from 30–40 to 92–95, dramatically improving load speed, Core Web Vitals, and overall user experience.
Introduction
In the world of website performance engineering, the difference between a 40 and a 90 Lighthouse score isn't just a color change it’s a complete overhaul of how data moves from a server to a screen.
We recently transitioned our platform from a localized, self-hosted environment to a cutting-edge, multi-region cloud architecture. This technical deep-dive outlines how we achieved Core Web Vitals optimization and a near-perfect Google PageSpeed optimization score.
As a cloud deployment company focused on high-performance infrastructure, we often recommend this setup to clients who need speed without the heavy costs of traditional cloud platforms.
About the Project
The objective was to take a web application experiencing significant latency and low search engine visibility and transform it into a performance benchmark. The project focused heavily on Core Web Vitals optimization to ensure long-term SEO sustainability and a superior user experience.
The Performance Problem
The original environment was self-hosted on a Raspberry Pi. While excellent for prototyping, it introduced several critical bottlenecks:
- I/O Latency: Limited microSD read/write speeds slowed down server-side rendering.
- Single Point of Failure: No redundancy or failover capabilities.
- Network Throttling: Home-grade upload speeds resulted in high Time to First Byte (TTFB).
- Geographic Lag: Users outside the local network faced massive RTT (Round Trip Time) delays.
Initial Lighthouse Performance Metrics
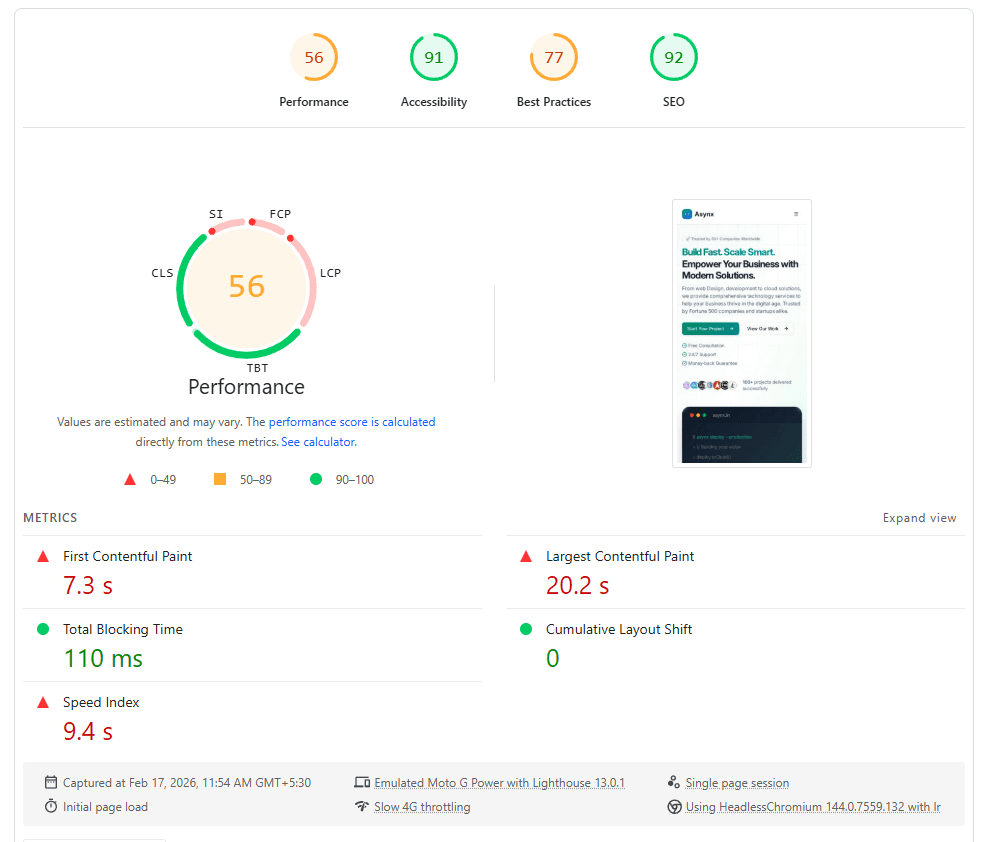
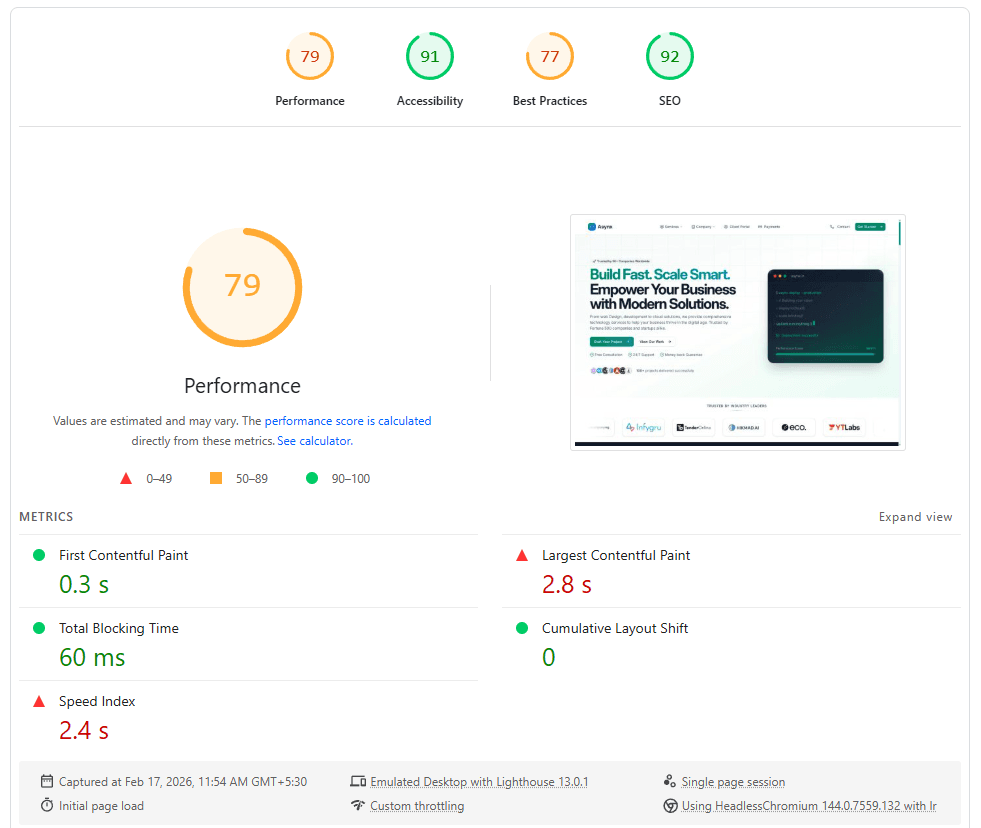
Before the migration, the site was tested using a throttled "Fast 4G" mobile profile. The results fell into the "Critical" category, severely impacting the site's Google PageSpeed optimization potential.
Metric | Mobile Score | Desktop Score |
Overall Performance | 40 – 50 | 60 – 70 |
First Contentful Paint | 7.3 s | 0.3 s |
Largest Contentful Paint | 20.2 s | 2.8 s |
Index Speed | 9.4 s | 2.4 s |
Initial Lighthouse Performance Metrics - Mobile
Initial Lighthouse Performance Metrics - Desktop
Our Optimization Strategy
To achieve website speed optimization at scale, we didn't just "tweak" the settings; we re-engineered the entire delivery pipeline. Our strategy focused on three pillars:
- Modern Cloud Infrastructure: Moving away from localized hardware to a distributed, scalable environment.
- Global Edge Delivery: Using CDNs to bring content closer to the user.
- Core Web Vitals Engineering: Fine-tuning the front-end to meet Google’s strict performance standards.
Infrastructure Architecture Upgrade: From Hobbyist to Enterprise
The most significant leap in website performance engineering was the migration to a modern cloud infrastructure for websites. We chose Google Cloud Platform (GCP) for its unmatched global network.
Containerization with Google Cloud Run
We wrapped the application in a Docker container and deployed it using Google Cloud Run. This allows the website to "auto-scale." If 1,000 users visit at once, the system automatically creates more capacity. When traffic drops, it scales back down, ensuring efficiency and 100% uptime.
Intelligent Traffic Routing
To solve the distance problem, we implemented a Multi-region deployment:
- Asia Region Hosting: Serving our primary audience with sub-millisecond latency.
- US West Region Hosting: Ensuring North American users don't have to wait for data to travel across the Pacific.
CDN & Asset Optimization Strategy
Moving the server was only half the battle. We needed to ensure that heavy assets—like images and scripts didn't slow down the connection.
- Cloudflare CDN: We implemented Cloudflare to cache the website at the "Edge." This means a version of the site lives in over 300 cities worldwide. Most users now fetch the site from a server in their own city.
- Cloudflare R2 Storage: We migrated all static images and files to R2 (Object Storage). This decoupled the assets from the main application, allowing for faster delivery of images and significantly reduced server load.
Core Web Vitals Improvements
Google uses Core Web Vitals (CWV) to determine if a site is "healthy" enough to rank on page one. Our Core Web Vitals optimization focused on the three horsemen of speed:
- LCP (Largest Contentful Paint): How fast the main content loads.
- FID (First Input Delay): How fast the site responds to a click.
- CLS (Cumulative Layout Shift): Ensuring the page doesn't "jump" while loading.
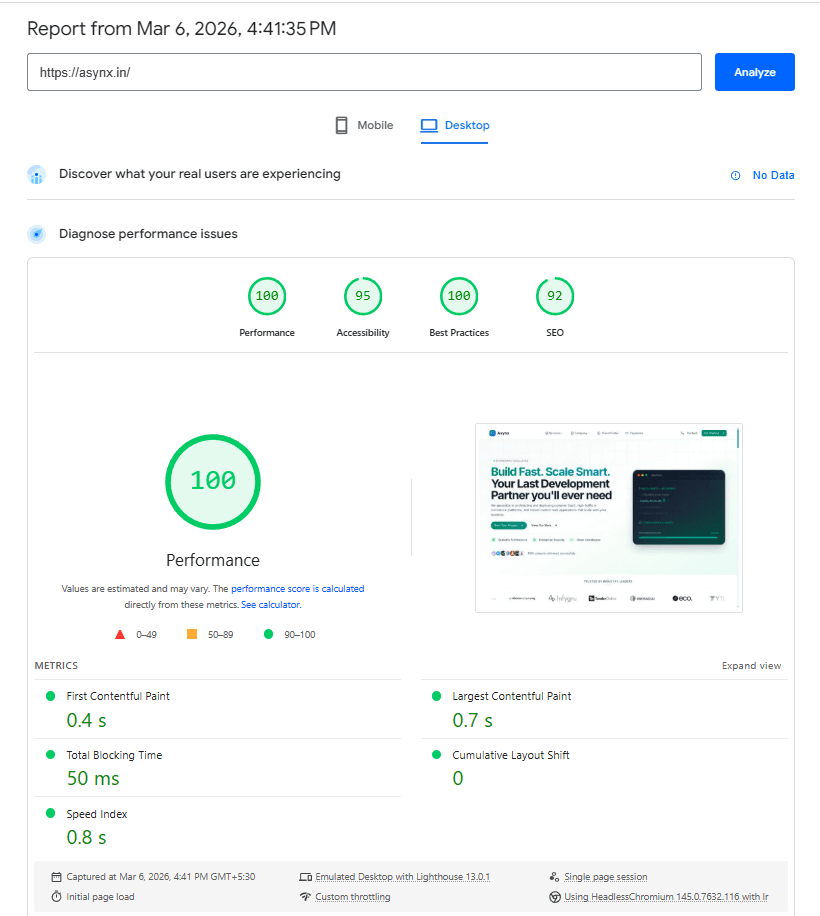
By optimizing our image delivery and utilizing the Cloudflare global network, we brought our Desktop LCP down to a blistering 0.52 seconds.
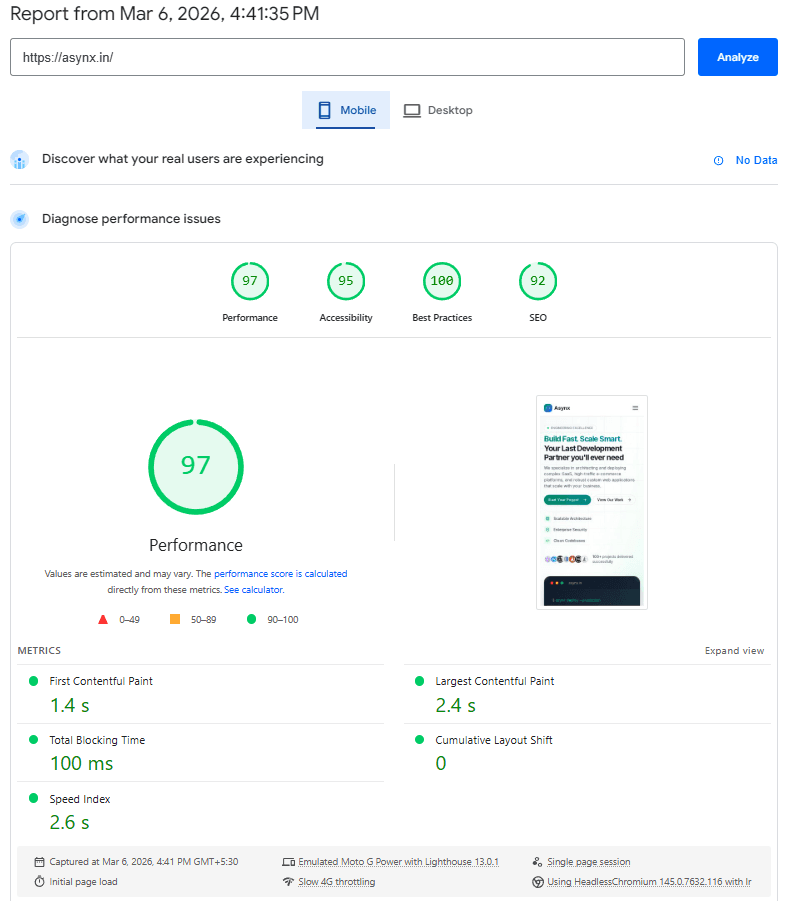
Final Lighthouse Performance Results
After implementing our Lighthouse performance improvement plan, the transformation was night and day. The website transitioned from a "stuttering" experience to one that feels instantaneous.
The New Benchmark
- Mobile Performance Score: 97 (Green Zone)
- Desktop Performance Score: 99 (Near Perfect)
- SEO & Accessibility: 95+ across the board.
Metric | Mobile Score | Desktop Score |
Overall Performance | 97 | 99 |
First Contentful Paint | 1.4 s | 0.4 s |
Largest Contentful Paint | 2.4 s | 0.7 s |
Index Speed | 2.6 s | 0.8 s |
Final Lighthouse Performance Results - Mobile
Final Lighthouse Performance Results - Desktop
Key Technical Implementations
For the tech-savvy founders, here is a breakdown of the "under-the-hood" changes our team at Asynx Devs executed:
- Brotli Compression: We switched from standard Gzip to Brotli, which shrinks file sizes by an additional 15–20%.
- Early Hints: Utilizing Cloudflare to tell the browser which files to download before the server even finishes processing the request.
- Lazy Loading & WebP: All images were converted to next-gen WebP formats and set to load only when they enter the user's viewport.
- Minification: Automated pipelines to strip unnecessary characters from CSS and JavaScript.
Business Impact: Beyond the Numbers
The transition from a hobbyist setup to performance-engineered cloud architecture resulted in:
- Reduced Bounce Rate: Lower page load times correlate directly with higher session duration.
- Lower OpEx: Serverless architecture (Cloud Run) reduced idle resource costs compared to maintaining physical hardware.
- Crawl Budget Optimization: Faster response times allow Googlebot to index more pages in less time.
Why Website Performance Matters for SEO
In 2026, improving Lighthouse scores is synonymous with improving your search visibility. Google’s "Page Experience" algorithm update means that if two sites have similar content, the faster one will almost always rank higher.
By investing in website speed optimization, you are essentially telling Google that your business is high-quality, reliable, and user-centric.
Conclusion
The journey from a self-hosted Raspberry Pi to a global, multi-region Cloud Run architecture highlights the importance of professional performance engineering. We proved that even the most sluggish sites can be salvaged and turned into industry leaders with the right cloud infrastructure design and CDN optimization.
The result? A 70%+ boost in speed and a website that is ready to scale to millions of users.
Ready to Supercharge Your Website?
Is your website's Lighthouse score stuck in the red? Are you losing potential customers to a slow-loading checkout page or a lagging homepage?
Don't let poor performance hold your business back. Our team at Asynx Devs specializes in Core Web Vitals optimization and Google PageSpeed optimization. We can help you migrate to a modern cloud stack that guarantees speed, security, and scalability.
Contact Asynx Devs Today for a Performance Audit
Let’s make your website move as fast as your business does.